How Native-Language Outreach Doubled Reply Rates: A/B Test Insights from the Baltics
We A/B tested English vs local copy.
And the results were hard to ignore. Here’s hard data from 3 recent campaigns.
🔍 Screenshot #1 – Baltics market, same ICP, same offer, different languages
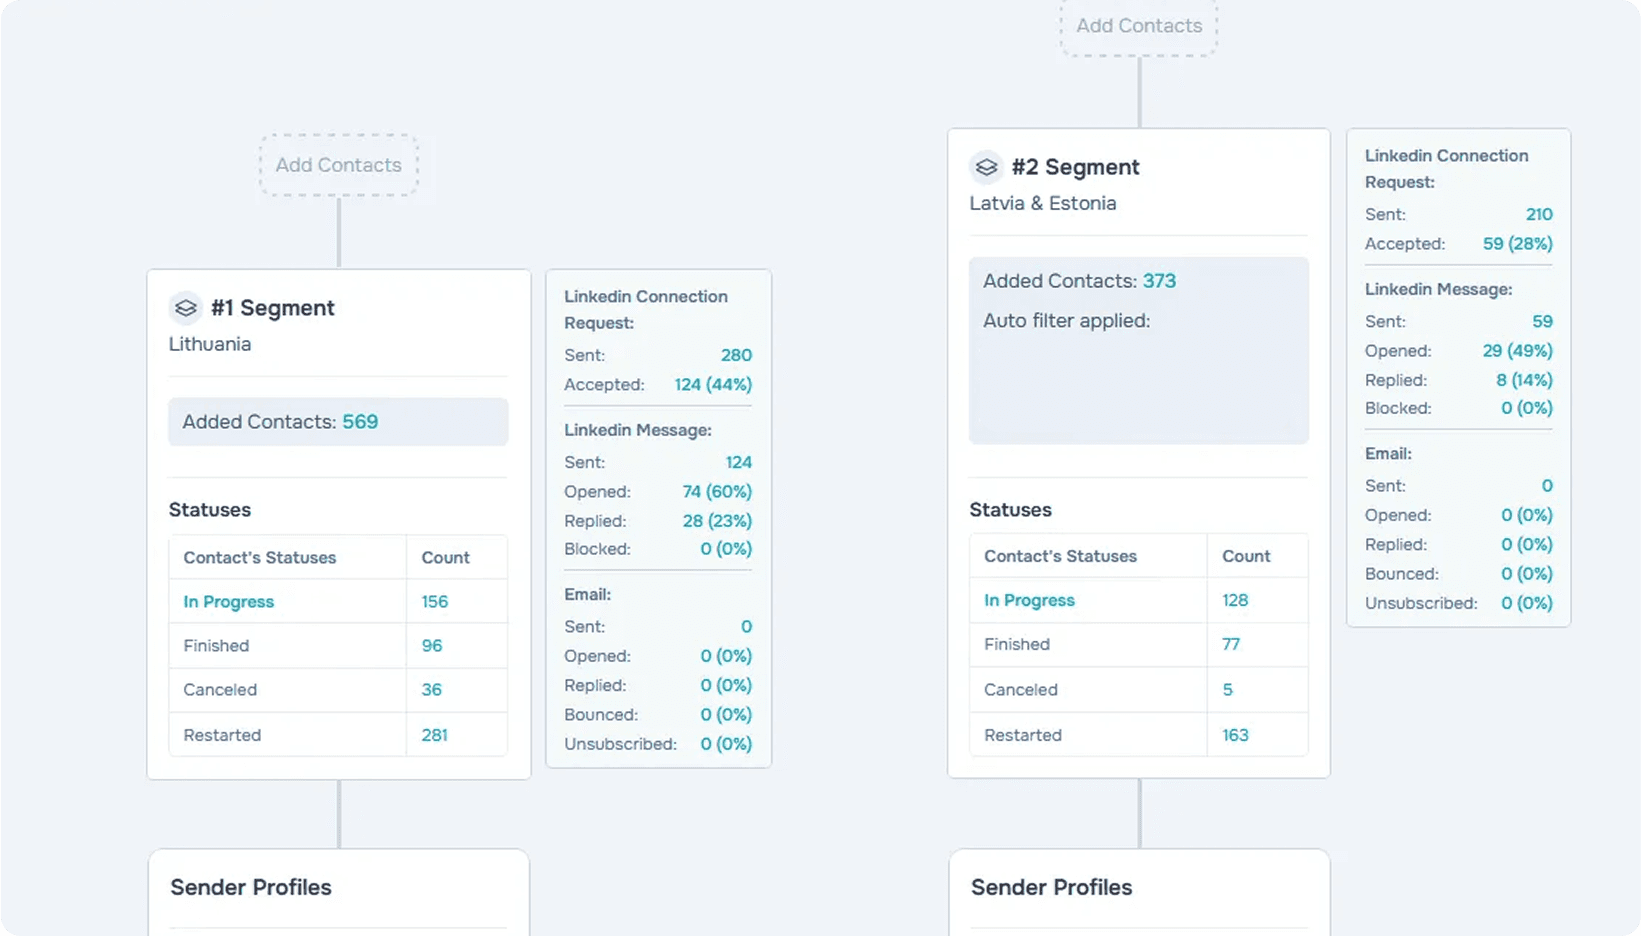
Latvia & Estonia, message in English:
28% connection acceptance
14% replied after message
Lithuania, message in Lithuanian:
44% connection acceptance (⬆️ 57%)
23% replied after message (⬆️ 64%)
Same structure. Same CTA. Just localized wording — and it dramatically changed performance.
🔍 Screenshot #2 – another client, another sender account
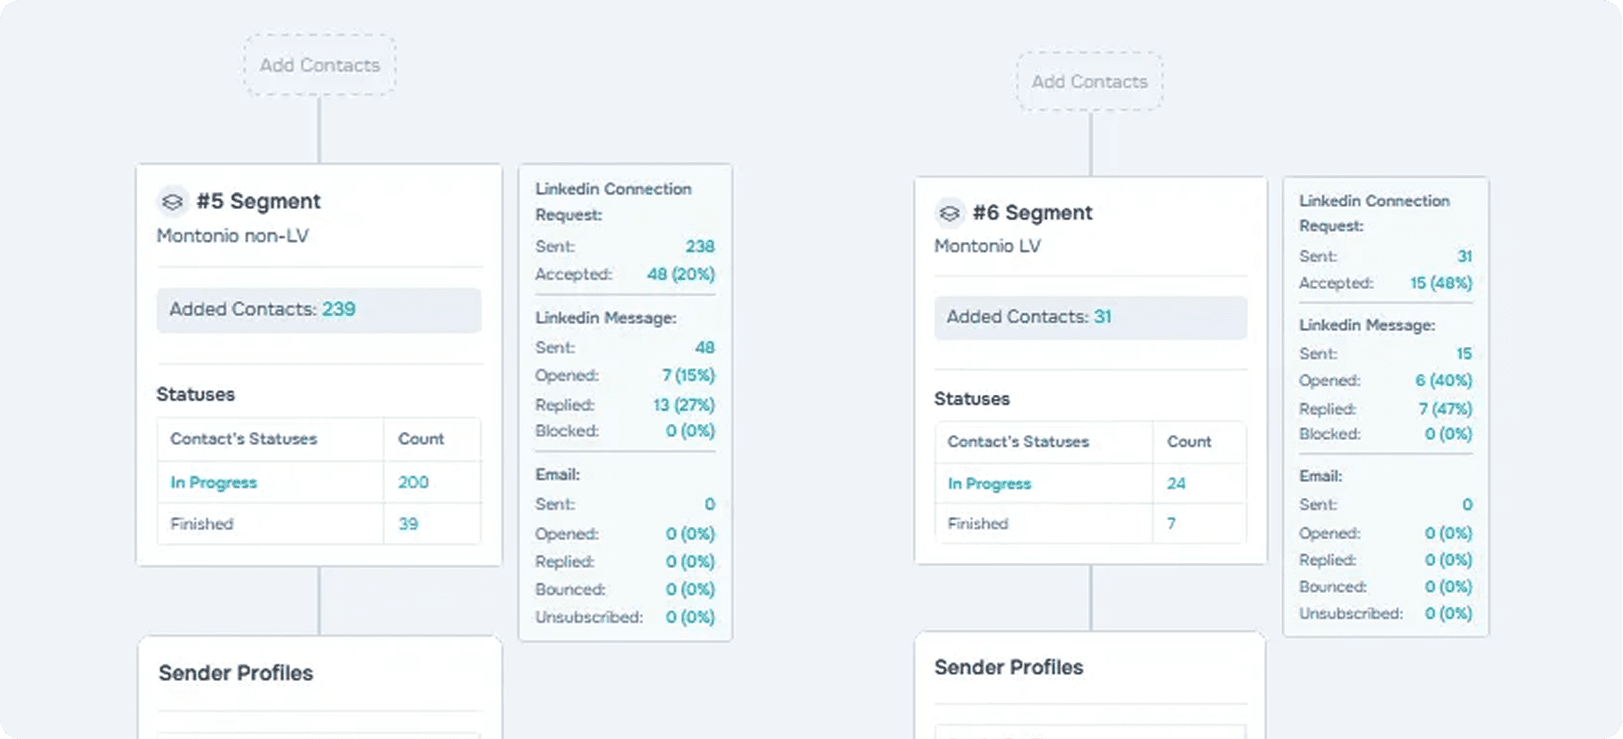
Latvian audience, English:
20% acceptance
27% reply rate
Same audience, native Latvian:
48% acceptance (⬆️ 140%)
47% reply rate (⬆️ 74%)
🔍 Screenshot #3 – follow-ups
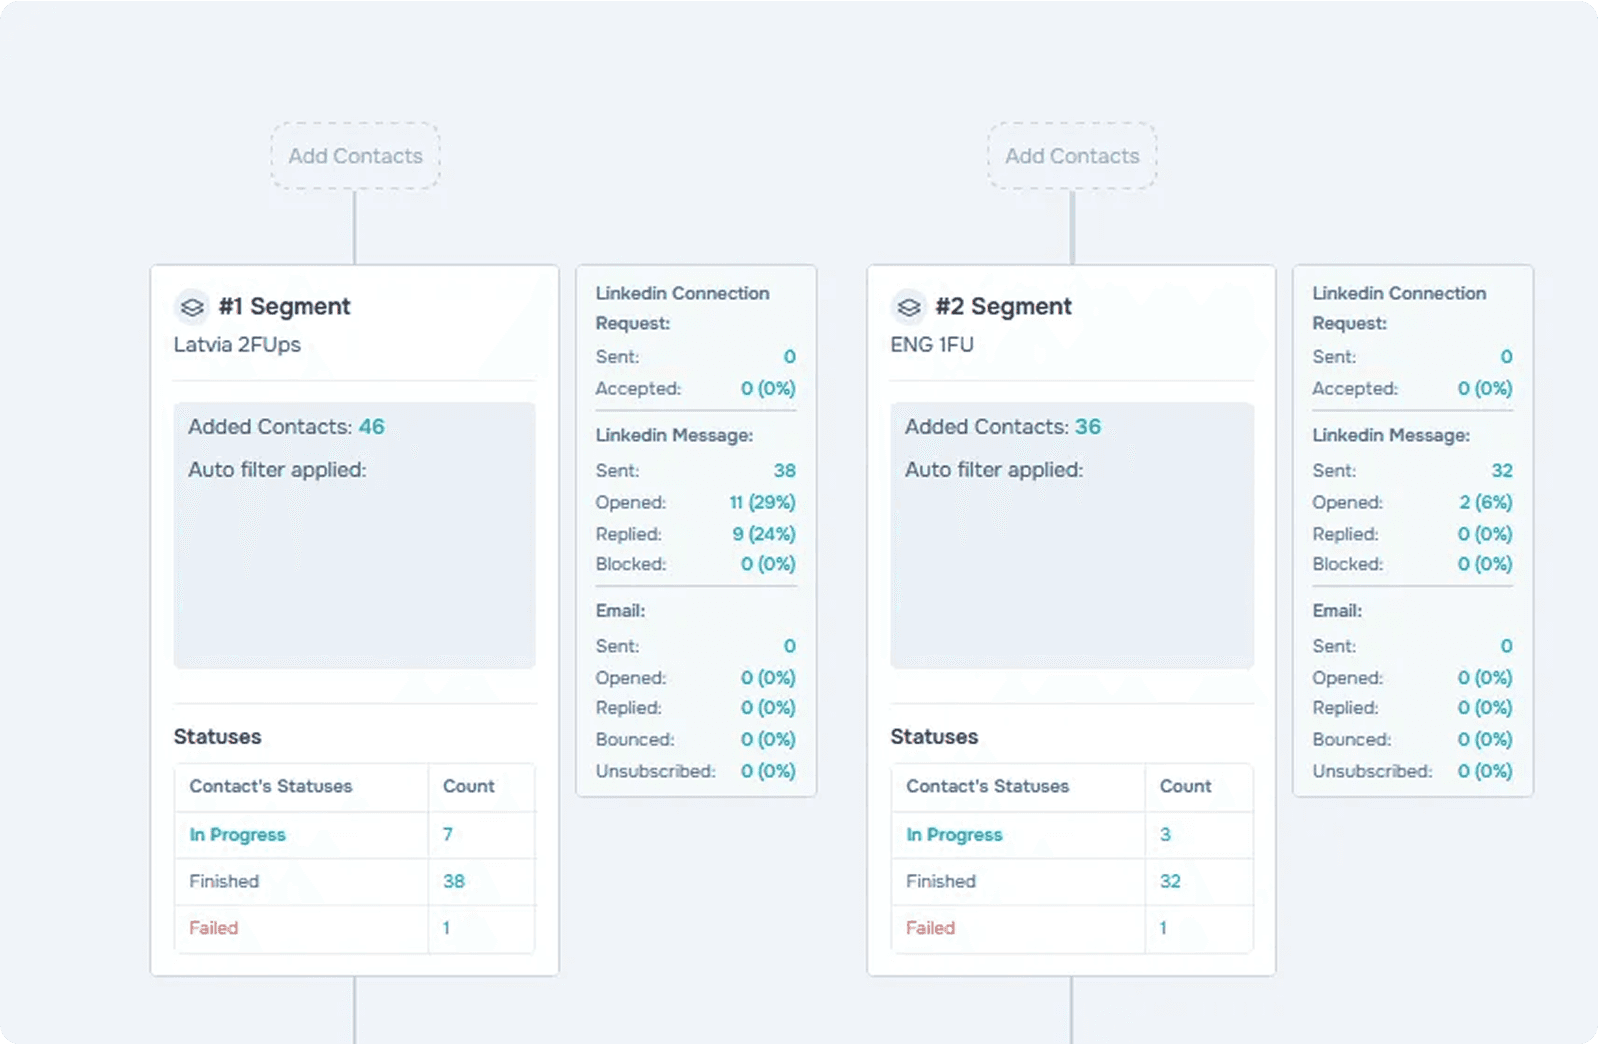
People who saw messages in their native language not only opened them more often, but were far more likely to reply to 2nd and 3rd messages. Localization doesn't just improve top-of-funnel — it sustains engagement.
Latvian audience, English:
6% opened
0% reply rate
Same audience, native Latvian:
29% opened (⬆️ 383%)
24% reply rate (⬆️ 2400%)
💡 Outreach copy in the local language = higher trust, higher reply rate, better results. Even if the target speaks English well — native-language communication feels warmer, more relevant, and less “salesy.”
Thinking about testing this with your campaigns? We’ll help you localize + run the A/B test to measure the impact in 2 weeks.
Get Your Qualified Leads Now
We deliver qualified B2B leads that convert into paying customers. Let us help you achieve your sales goals